AI analytics that gives the same number as the certified report.
At BNY I’m building an AI-enabled analytics layer that lets business users ask questions and create dashboards in plain language, on top of the governed data finance already trusts.
- Role
- Vice President, Data Engineering
- Since
- September 2026
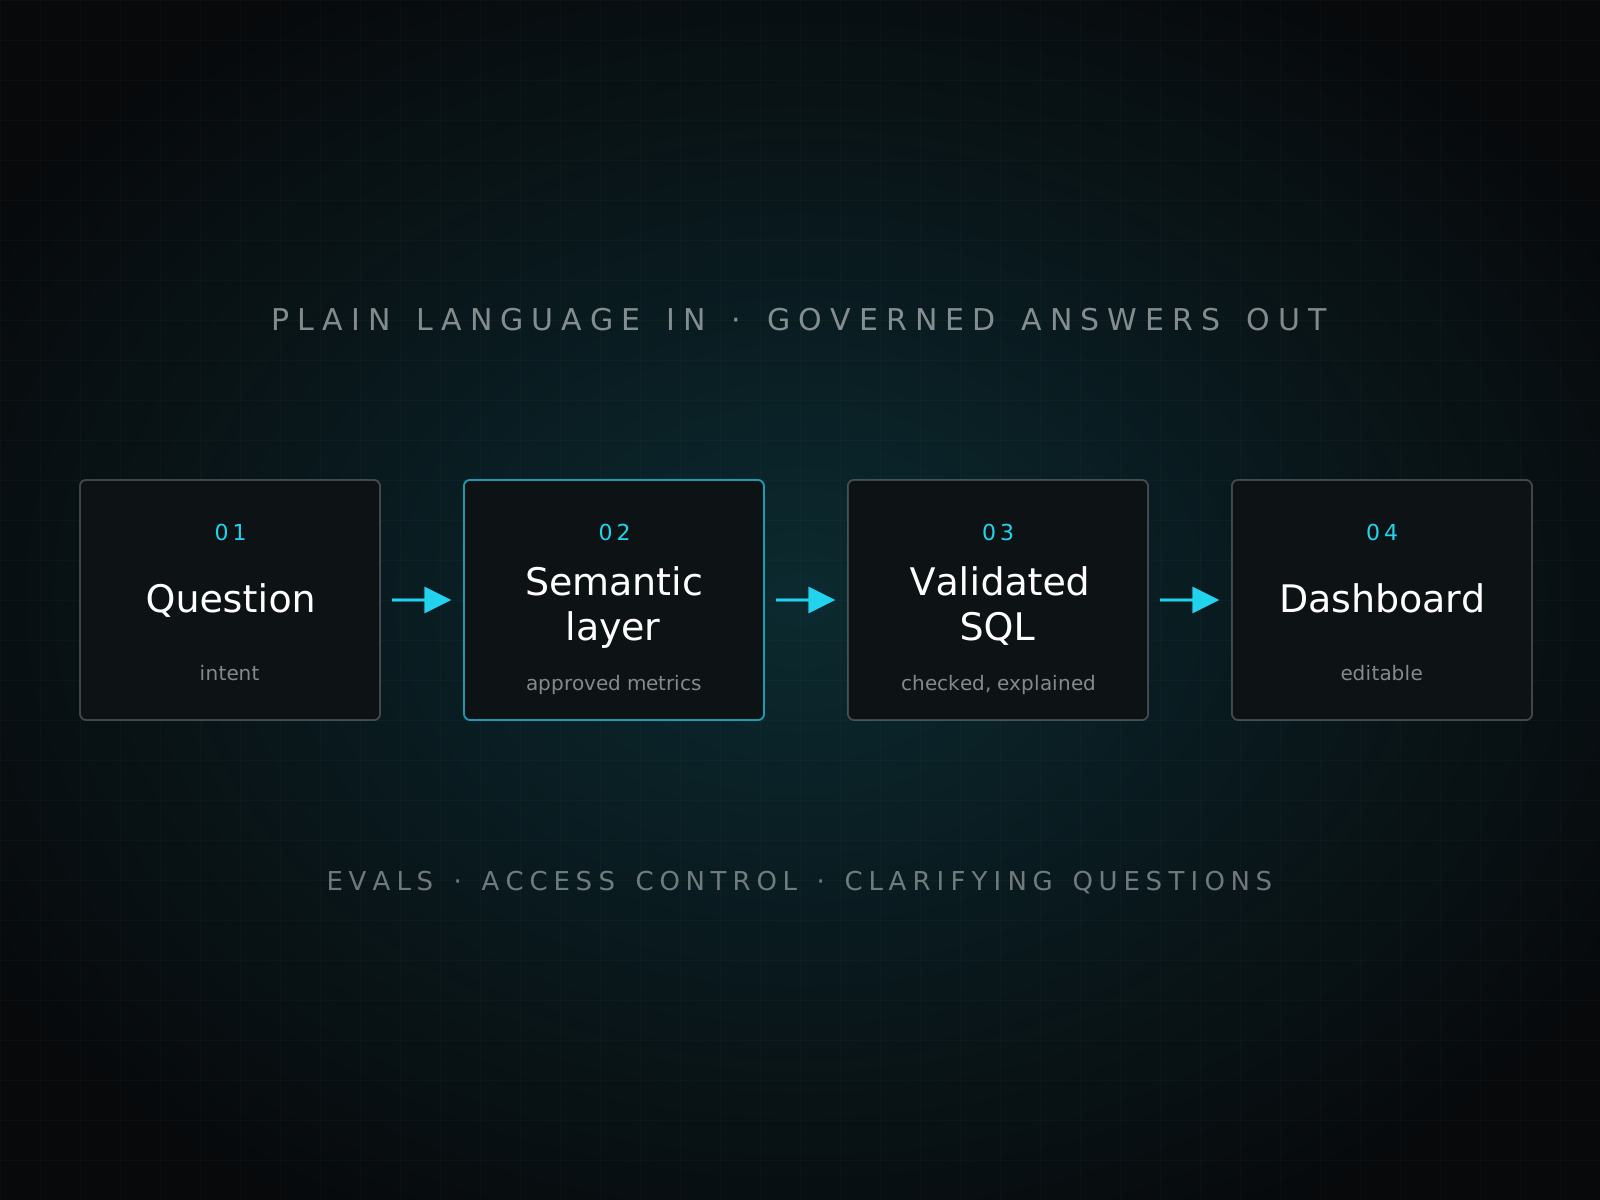
Described in words only: no employer code, data or screenshots. The diagram below is a generic sketch.
01 · The problem
A fast answer that disagrees with the report is worse than a slow one.
In finance, a number only counts if it matches the certified report. An AI tool pointed at raw tables can give a confident answer that is off by a definition: the wrong join, the wrong period, a different idea of what a metric means. Nobody can tell until someone checks it by hand.
So the hard part isn’t getting a model to write SQL. It’s making sure every query it writes uses the same definitions as the reports people already rely on.
02 · What I’m building
Governed data first, then the AI on top.
01
AI-ready datasets
Curated datasets with documented business context and governed metric definitions, so an answer from a model matches the certified report.
02
A semantic layer
Business terms mapped to approved metrics, dimensions and joins. Agents query this safe, consistent surface instead of raw tables.
03
Prompt-to-dashboard
Users describe a view in plain language. The system resolves the intent to governed metrics, generates the query and visual spec, and renders an editable dashboard.
04
A data agent
It plans multi-step analyses, generates and validates SQL against the semantic layer, and explains how each answer was derived.
03 · Keeping it honest
Guardrails and evaluation, built in.
An answer is only useful if you know how often it is right and who is allowed to see it. The layer is measured and controlled with:
- Test sets of real business questions
- Accuracy tracking
- Role-based data access
- Clarifying questions when intent is ambiguous
04 · What came before
AI-assisted analytics for 1,000+ finance users.
From 2024 to 2026, as Vice President, Data and Analytics, I owned AI-enabled data and analytics products for FP&A and Controllers, serving 1,000+ users across reporting, close, planning and performance management.
That included AI-assisted analytics with internal LLM and RAG tools, Power BI Copilot and Fabric Copilot: variance commentary, natural-language exploration and executive summaries, including RAG solutions that explain expense variance and headcount movements. Underneath it were governed data products integrating ERP, CRM and planning data into curated datasets.
The current work applies that foundation to agents.
05 · See the ideas in public
Try them on sample data.
Scout, my own AI data analyst, explores the same ideas on a fictional sample company: shared metric definitions, validated queries and answers that show where they looked.